Monitoring Klipper with Prometheus and Grafana

Unless you work in high-tech or IT you may not be familiar with Prometheus or Grafana. These are a couple of open source monitoring and visualization tools commonly used together in cloud native applications and used by some of the largest corporations and cloud vendors to monitor applications and infrastructure.
For this article I’m going to cover how I use these two tools for monitoring metrics from my Ender3 v2 running Klipper firmware. Whether your running a single 3D printer like me, or an entire print farm, hopefully you will find this useful.

There are two primary sets of metrics I’m interested in, data from Klipper and data from the host running the Klipper software, in my case a Raspberry Pi Zero 2 W. A third set of metrics to monitor is how the data collection itself is performing, to ensure the act of monitoring is not having an adverse effect on the systems.
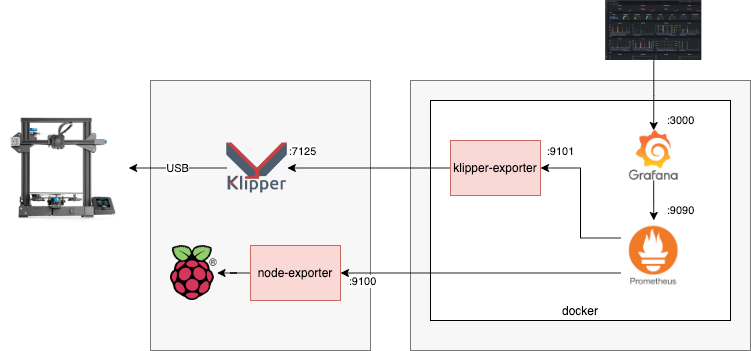
Prometheus is a polling data collector and time series data store. To collect data from specific sources either the source needs to implement a Prometheus metrics interface, or an intermediary collector, known as an exporter, sits between Prometheus and the data source to capture the metrics and converts to the required format.
For monitoring Klipper and the Klipper host we need to use two exporters, first is the Node Exporter to collect host system metrics, and the second is the Klipper Exporter (by yours truly) to collect the Klipper metrics.
Installation
Install Node Exporter
Node Exporter collects a large number of system metrics for CPU, memory, network, file system and more. It is available for most systems through the OS package manager, or can be installed manually using these instructions. For the Raspberry Pi run:
sudo apt install prometheus-node-exporterAfter installation I recommend modifying /etc/default/prometheus-node-exporter to disable the systemd collector, as on the Pi Zero these metrics add a significant collection overhead. At the top of the config file modify the ARGS setting, and then restart the exporter service.
ARGS="--no-collector.systemd"sudo systemctl restart prometheus-node-exporter.serviceInstall Klipper Exporter
The prometheus-klipper-exporter is used to collect metrics from Klipper via the Moonraker API. It can either be installed on the same host as Klipper, or on a separate host. A single exporter installation can collect metrics from multiple Klipper instances.
For simplicity Prometheus, Grafana and the Klipper Exporter can all be run using Docker and deployed on the same host. I recommend using a different host from the one running Klipper.
Running Prometheus and Grafana in Docker
You need to have Docker installed on the host you’ll be running, I’m not going to cover those steps, there are lots of guides available. The entire Prometheus, Grafana and Klipper Exporter stack can be deployed using a single Docker Compose configuration.
Create the file docker-compose.yml, changing the GF_SECURITY_ADMIN_PASSWORD and other security and authentication settings as appropriate. Also change the dns to the IP address of your local router.
# docker-compose.yml
version: '2'
services:

  prometheus:
    image: prom/prometheus:latest
    container_name: prometheus
    hostname: prometheus
    volumes:
      - ./prometheus.yml:/etc/prometheus/prometheus.yml
      - prometheus-data:/prometheus
    command:
      - '--config.file=/etc/prometheus/prometheus.yml'
      - '--storage.tsdb.path=/prometheus'
      - '--web.console.libraries=/usr/share/prometheus/console_libraries'
      - '--web.console.templates=/usr/share/prometheus/consoles'
      - '--storage.tsdb.retention.time=30d'
    expose:
      - 9090
    ports:
      - 9090:9090
    restart: unless-stopped
    dns:
       192.168.1.1

  grafana:
    hostname: grafana
    image: grafana/grafana:latest
    container_name: grafana
    restart: unless-stopped
    volumes:
      - grafana-data:/var/lib/grafana
    environment:
      GF_SERVER_ROOT_URL: http://localhost
      GF_SECURITY_ADMIN_PASSWORD: 'password1234!@#$' # change password
      GF_AUTH_ANONYMOUS_ENABLED: 'true'
      GF_AUTH_ANONYMOUS_ORG_ROLE: 'Editor'
      GF_SECURITY_ALLOW_EMBEDDING: 'true'
    ports:
      - "3000:3000/tcp"

  klipper-exporter:
    hostname: klipper-exporter
    image: ghcr.io/scross01/prometheus-klipper-exporter:latest
    container_name: klipper-exporter
    restart: unless-stopped
    expose:
      - 9101
    dns:
       192.168.1.1

volumes:
  prometheus-data:
    external: false
  grafana-data:
    external: false
Before starting the application stack we need to create a Prometheus configuration file prometheus.yml to set where to poll the metrics from. Change klipperhost in the “klipper” and “node” targets to the hostname or IP address of the Klipper host. If you have multiple printers you can set a comma separated list of hosts. Port 7125 is the default for the Klipper Moonraker API. Port 9100 is default for Node Exporter.
# prometheus.yml
scrape_configs:

  - job_name: "klipper"
    scrape_interval: 5s
    metrics_path: /probe
    static_configs:
      - targets: [ 'klipperhost:7125' ]
    params:
      modules: [
        'process_stats',
        'network_stats',
        'system_info',
        'job_queue',
        'directory_info',
        'printer_objects',
        'history'
      ]
    relabel_configs:
      - source_labels: [__address__]
        target_label: __param_target
      - source_labels: [__param_target]
        target_label: instance
      - target_label: __address__
        replacement: klipper-exporter:9101

  - job_name: 'node'
    scrape_interval: 15s
    static_configs:
      - targets: ['klipperhost:9100']

  - job_name: "klipper-exporter"
    scrape_interval: 5s
    metrics_path: /metrics
    static_configs:
      - targets: [ 'klipper-exporter:9101' ]
Now we can start it up
$ docker compose up -dChecking the metrics collection
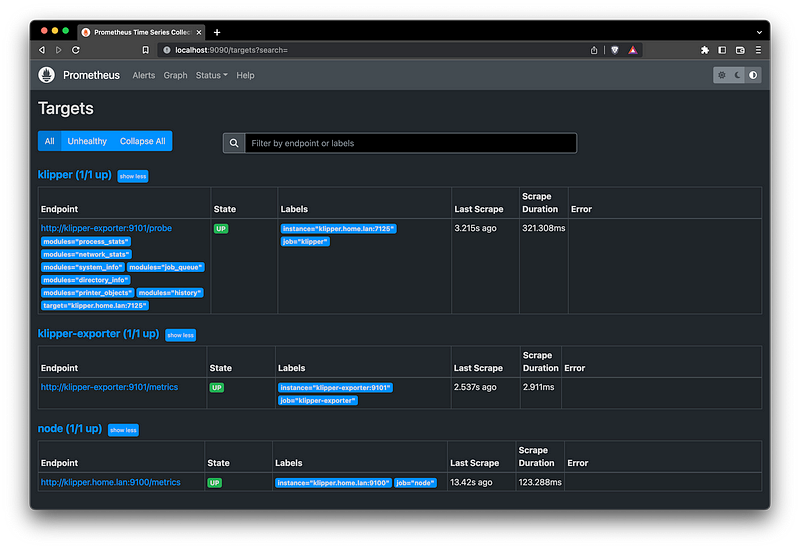
Open http://localhost:9090/targets to view the Prometheus collector status, all targets should show as up

Creating Grafana dashboards
Open http://localhost:3000/ to start creating Gafana dashboards. Login as admin using the password set in the docker-compose.yml
First we need to add Prometheus as a data source. From the settings menu select Data sources and then Add data source. Choose Prometheus from the list and set the URL to http://prometheus:9090. Select Save and Test and you should see a confirmation that the data source is working.
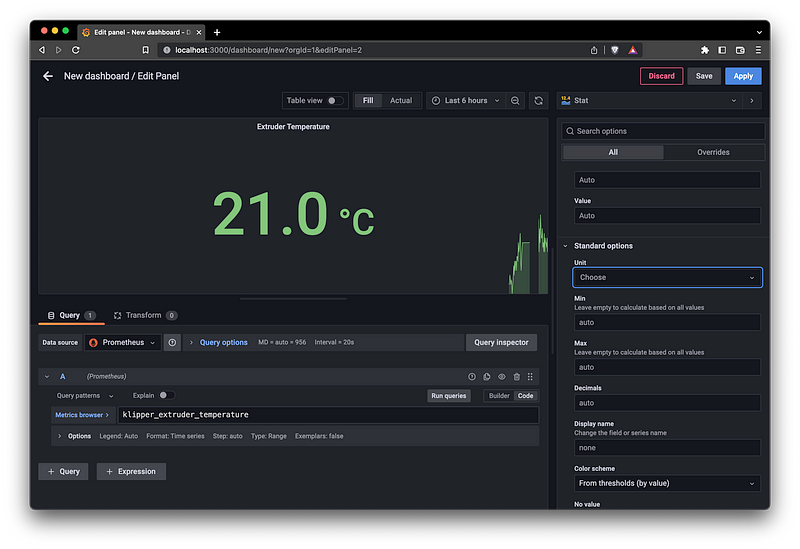
Now to create some charts. From the Dashboards menu select New Dashboard and Add a new panel. Use the metrics browser to find metrics of interest, for example we can pick the klipper_extruder_temperature metrics and select the Stat panel type to show the current extruder temperature. Select Apply to add the chart to the dashboard.

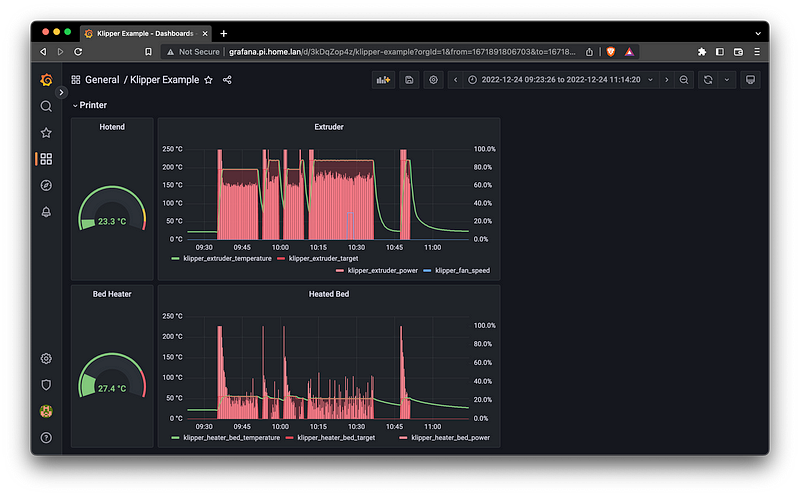
An example dashboard is included with the klipper-exporter project that can be imported into Grafana by selecting to Import option and uploading the JSON file.
More Information


